Neil Bhutta, Steven Laufer, and Daniel R. Ringo1
Data collected under the Home Mortgage Disclosure Act (HMDA) reveal that the largest banks have significantly reduced their share of mortgage lending to low- and moderate-income (LMI) households in recent years. We present evidence suggesting that this reduction is explained in part by a decrease in the largest banks’ willingness to originate mortgages insured by the Federal Housing Administration (FHA).
The Decline in Lending to LMI Borrowers
Figure 1 shows trends over time and across lender categories in the fraction of home-purchase loans originated to LMI borrowers, defined under the Community Reinvestment Act (CRA) as those borrowers with incomes less than 80 percent of estimated current area median family income.2While the trends among nonbank lenders and smaller bank lenders have been similar over the past few years, the largest three bank mortgage lenders experienced a notably steeper decline in LMI lending compared to the rest of the market. These three banks–Wells Fargo, Bank of America and JPMorgan Chase–together originated about 9 percent of all mortgages reported in the 2016 HMDA data and account for nearly one-third of all deposits in the United States.3 As shown in the figure, the LMI share among these three banks declined 17 percentage points, from 32 percent in 2010 to 15 percent in 2016. Over the same period, smaller banks and non-bank lenders (including credit unions and independent mortgage companies) reduced their LMI share by 9 percentage points overall.
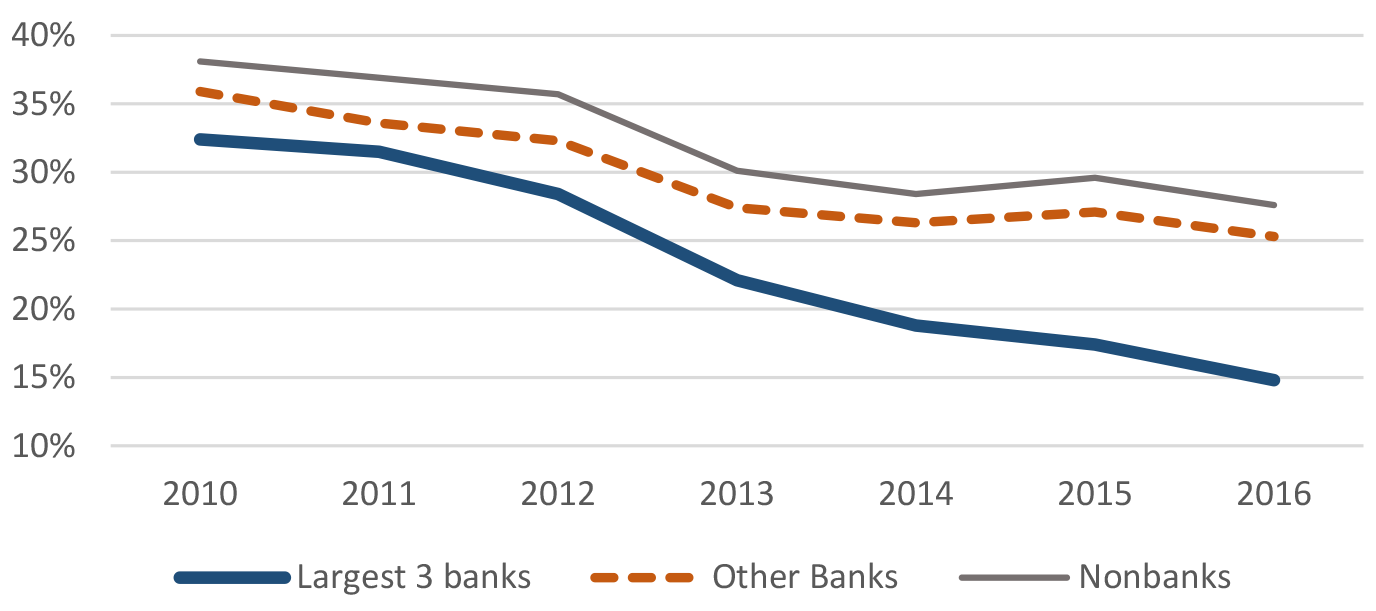
Note: The nonbank category excludes lenders identified as subsidiaries or affiliates of depository institutions. Source: Federal Financial Institutions Examination Council (U.S.).
The same pattern of larger declines in LMI lending by the largest banks is also evident when we compare different lenders within the same county. Comparing lending patterns within counties alleviates the concern that the three largest banks may have had larger declines in LMI lending only because they were concentrated in counties with larger declines in mortgage demand by LMI borrowers. In 2010, a mortgage originated by one of the three largest banks was 2-1/2 percentage points less likely to go to an LMI borrower than a mortgage originated by other lenders in the same county. By 2016, the difference had widened to 8-1/2 percentage points (see figure 2).
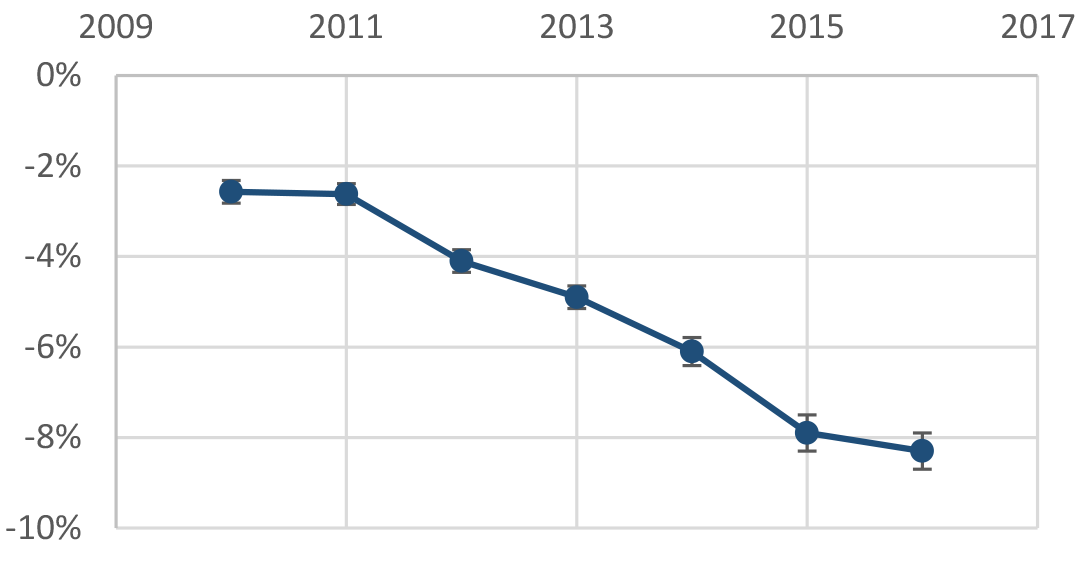
Note: Graph shows coefficients on a dummy variable for the lender being Wells Fargo, JPMorgan Chase or Bank of America in a regression estimating the probability that the borrower was LMI, controlling for county fixed effects. Error bars show standard errors, which are clustered by county. Source: Federal Financial Institutions Examination Council (U.S.).
The relatively steep reduction in the LMI share of lending by large banks is somewhat puzzling because the LMI lending share is an important – although not the only – metric by which banks’ compliance with the CRA is judged.4 Federal banking regulators take these examinations into account in evaluating banks’ applications to engage in mergers and acquisitions or open new branches. Banks with less-than-satisfactory ratings on their CRA examinations may have their applications denied and be unable to move forward with expansion plans. In addition, CRA ratings are disclosed to the public and good ratings can generate positive publicity. Given the incentives under the CRA, why might these banks have had such notable declines in their LMI share of lending?
The Decline in FHA Lending
A second trend in the mortgage originations of the largest banks that might help explain their declining LMI share is a coincident decline in their origination of loans insured by the Federal Housing Administration (FHA). FHA insurance protects lenders against losses in the event of borrower default, and so allows borrowers with relatively small down payments or relatively low credit scores to access mortgage credit they might otherwise be denied. FHA loans are disproportionately used by LMI borrowers for these reasons.5
As shown in figure 3, the FHA share of loans originated by the three largest banks fell from 43 percent in 2010 to just 5 percent in 2016. Because FHA loans are much more likely to be originated to LMI borrowers, this decline is likely related to these banks’ decrease in LMI lending. The share of FHA lending also declined for other banks and for nonbank lenders, though not as sharply as for the largest three banks.
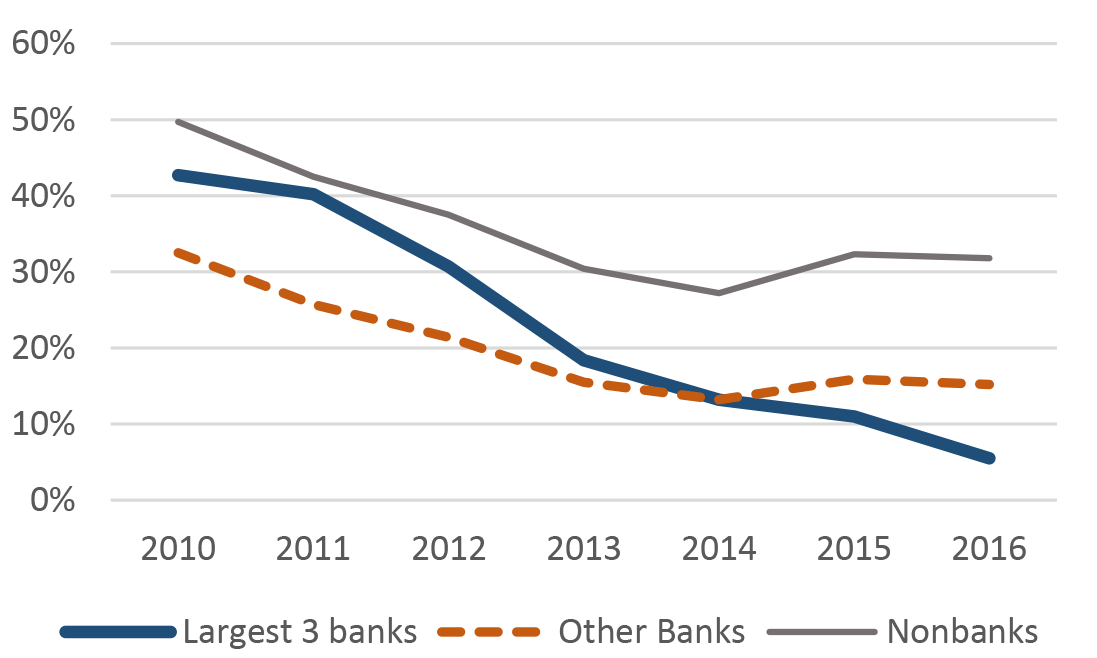
Source: Federal Financial Institutions Examination Council (U.S.).
The disproportionately large decline in both LMI and FHA lending by the largest three banks raises two questions. First, why did these largest three bank lenders reduce their FHA originations by more than other lenders during this period? Second, how much of the “excess” decline in lending to LMI borrowers by the three largest banks can be accounted for by the larger decline in FHA mortgages?
Reasons for the Decline in FHA Lending
One possible reason for the disproportionate decline in FHA lending by the largest banks could be related to recent litigation brought against them by the Department of Justice under the False Claims Act. The Department of Justice has argued that lenders who improperly certify mortgages as eligible for FHA insurance may be held liable for making false claims to the United States government, subjecting them to treble damages.6 Since 2011, the Department of Justice has sued a number of large mortgage lenders for violations of the False Claims Act, including each of the largest three bank lenders. The costs of these lawsuits have been large: for example, Wells Fargo reached a $1.2 billion settlement with the Department of Justice in 2016.7 While other lenders have also been targeted in these lawsuits, large banks have been particularly explicit about the effect of these lawsuits on their FHA lending. For example, in an April 2015 letter to shareholders, JP Morgan Chase CEO Jamie Dimon explained that the company had reduced its FHA lending in part because of the risk “from the penalties that the government charges if you make a mistake.”8
Several other factors have also contributed to the overall decrease in FHA lending since 2010. First, rising FHA insurance premiums over this period likely shifted demand away from the FHA.9Second, lenders have faced significant uncertainty around the FHA’s “indemnification” policy, which defines circumstances under which FHA insurance is voided because the loans are judged to be improperly underwritten.10 Third, the cost of servicing a delinquent FHA mortgage rose significantly during this period.11 While each of these factors likely raises the expected costs associated with FHA-guaranteed mortgages for all lenders, they could have induced larger reactions from the large bank lenders, whose overall profits are less dependent on their mortgage lending business.
The Effect of FHA Lending on LMI Lending
To measure the connection between the decline in LMI lending and the decline in FHA lending, we decompose the LMI share of each lender into three components: i) the share of FHA mortgages going to LMI borrowers (which we denote “(LMI | FHA)“), ii) the share of non-FHA mortgages going to LMI borrowers (LMI | not FHA), and iii) the share of all mortgages that carry FHA insurance (FHA). Then the LMI share can be written:
Each of these three components decreased from 2010 to 2016, contributing to the decline in LMI lending for both the largest three banks and for the rest of the market. To isolate the effect of the larger decline in FHA lending among the largest three banks, we ask what their LMI share would have been in 2016 if their FHA share had declined not by the actual amount (37 percentage points) but by the smaller amount experienced by the rest of the market (14 percentage points), leaving the decline in LMI lending among both FHA and non-FHA loans unchanged. In reality, the LMI share of lending by the largest banks fell over 8 percentage points more than the LMI share of all other lenders did from 2010 through 2016. Had the FHA share among large banks matched the decline among the rest of the market, their LMI share would have declined by only about 2-1/2 percentage points more than all other lenders (see figure 4). Thus, the larger decline in FHA lending among the three largest bank mortgage lenders can explain about three-fourths of their additional decline in lending to LMI borrowers.
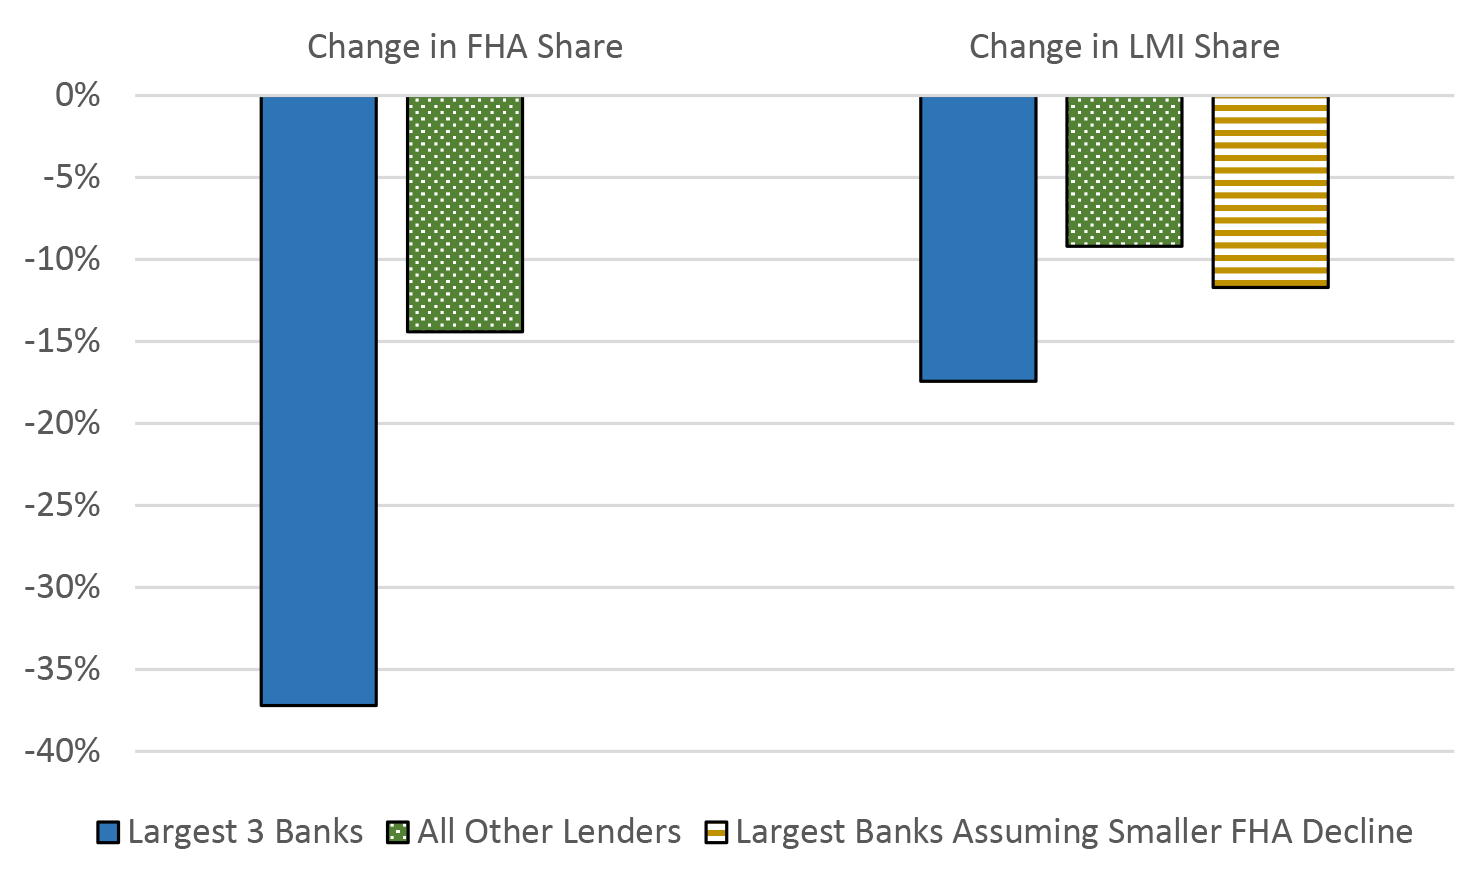
Source: Federal Financial Institutions Examination Council (U.S.).
Implications for Borrowers
From the borrowers’ perspective, an important question is whether big banks’ drop in FHA and LMI lending actually makes it more difficult for lower-income households to obtain credit, or whether these households are able to obtain similar mortgages from other lenders. Informing this question, several recent papers have found that when external events cause some mortgage lenders to reduce their lending, this reduction is not fully offset by increased lending from their competitors. For example, Gete and Reher (2017) consider the tightening of mortgage credit by lenders who experienced regulatory shocks following the Dodd-Frank Act. They find that areas with greater exposure to these lenders experience a greater overall restriction in the supply of credit, resulting in more households being unable to become homeowners. Similarly, Mondragon (2016) finds that counties more exposed to the collapse of a large mortgage lender experienced a larger reduction in total mortgage credit and ultimately in local employment rates.12 This research raises the possibility that as the largest banks reduce their mortgage lending to lower-income households, these borrowers may be unable to easily obtain loans from other sources.
References
Bhutta, Neil, and Daniel Ringo (2016). “Changing FHA Mortgage Insurance Premiums and the Effects on Lending,” FEDS Notes. Washington: Board of Governors of the Federal Reserve System, September 29, 2016, https://dx.doi.org/10.17016/2380-7172.1843
Bhutta, Neil, Daniel Ringo and Steven Laufer (2017). “Residential Mortgage Lending in 2016: Evidence from the Home Mortgage Disclosure Act Data,” Federal Reserve Bulletin, Forthcoming.
Community Affairs Office (2006). “New “Banker’s quick reference guide to CRA””, Federal Reserve Bank of Dallas, e-Perspectives, issue 3. https://www.dallasfed.org/assets/documents/cd/pubs/quickref.pdf
Dimon, Jamie (2016). “Chairman and CEO letter to shareholders”, JPMorgan Chase & Co. https://www.jpmorganchase.com/corporate/investor-relations/document/ar2015-ceolettershareholders.pdf
Federal Financial Institutions Examination Council (U.S.). Home Mortgage Disclosure Act (Public Data).
Garcia, Daniel (2017). “Declines in Mortgage Supply and Employment in the Great Recession,” unpublished manuscript. https://www.econ2.jhu.edu/seminars/Spring2017/Garcia_022117.pdf
Gete, Pedro and Michael Reher (2017). “Systemic Banks, Mortgage Supply and Housing Rents,” unpublished manuscript. https://ssrn.com/abstract=2756056
Goodman, Laurie (2016). “Servicing Costs and the Rise of the Squeaky-Clean Loan,” Mortgage Banking vol. 76 (5). https://www.urban.org/research/publication/servicing-costs-and-rise-squeaky-clean-loan
Mondragon, John, Household Credit and Employment in the Great Recession (December 16, 2014). Kilts Center for Marketing at Chicago Booth – Nielsen Dataset Paper Series 1-025. https://ssrn.com/abstract=2521177
Parrott, Jim (2014). “Lifting the Fog around FHA Lending?” Housing Finance Policy Center Commentary. Urban Institute, https://www.urban.org/sites/default/files/publication/22391/413053-Lifting-the-Fog-around-FHA-Lending-.PDF
U.S. Department of Housing and Urban Development, Office of Policy Development and Research (2017). “FY 2017 INCOME LIMITS: Frequently Asked Questions,” Washington: Department of Housing and Urban Development, https://www.huduser.gov/portal/datasets/il/il17/FAQs-17.pdf
U.S. Department of Justice, Office of Public Affairs (2016). “Wells Fargo Bank Agrees to Pay $1.2 Billion for Improper Mortgage Lending Practices,” Washington: Department of Justice, https://www.justice.gov/opa/pr/wells-fargo-bank-agrees-pay-12-billion-improper-mortgage-lending-practices
1. Board of Governors of the Federal Reserve System. The views expressed in this note are solely those of the authors and not necessarily those of the Federal Reserve Board or others within the Federal Reserve System. Return to text
2. All statistics in this note refer to first-lien purchase mortgages for one- to four-family, owner-occupied, site-built homes, and are calculated from data reported under the HMDA (www.ffiec.gov/hmda). Return to text
3. In addition to these three banks, there were two other banks, and five nonbanks, among the top 10 mortgage lenders in 2016. The two other banks were U.S. Bank and Flagstar, but these banks are significantly smaller than the three largest banks. For example, the volume of deposits at Bank of America is almost four times larger than at U.S. Bank. For more detail on mortgage lending activity by the largest mortgage lenders in 2016, see Bhutta, Laufer and Ringo (2017). Return to text
4. The CRA only applies to federally-insured banks and thrifts, not to nonbank financial institutions or credit unions. For more on how banks are evaluated under the CRA, see for example, Community Affairs Office (2006). Because CRA examinations take into account many aspects of banks’ activities, a decline in LMI lending does not necessarily imply that a bank will receive a ratings downgrade. Return to text
5. In 2016, 37 percent of LMI borrowers used FHA insured mortgages compared to 21 percent of non-LMI borrowers. Return to text
6. Mortgages may be ineligible for FHA insurance if they are not underwritten or documented according to FHA guidelines. Return to text
7. See U.S. Department of Justice (2016). Return to text
8. See Dimon (2016), https://www.jpmorganchase.com/corporate/investor-relations/document/ar2015-ceolettershareholders.pdf. Not all lenders responded to False Claims Act lawsuits in the same manner. Quicken Loans has countersued the Department of Justice and continues to originate a large volume of FHA loans, maintaining its position as the largest FHA lender according to the 2016 HMDA data. Flagstar Bank, which reached a $133 million settlement in 2012, has also not retreated from the FHA market – over 30 percent of its home purchase originations in 2016 were for FHA loans. Return to text
9. See Bhutta and Ringo (2016). Return to text
10. See Parrott (2014) Return to text
11. See Goodman (2016) Return to text
12. Garcia (2017) reaches similar conclusions. Return to text
Disclaimer: FEDS Notes are articles in which Board economists offer their own views and present analysis on a range of topics in economics and finance. These articles are shorter and less technically oriented than FEDS Working Papers.