Housing costs are a severe financial burden to many low-income families. The typical renter in the bottom quintile of the income distribution spends more than half of monthly income on rent and has less than $500 dollars left after paying rent. Moreover, the percent of income that this group spends on rent has risen about 10 percentage points since 2000. How much income it takes to cover rent or mortgage payments can affect the economic well-being and financial stability of families.2 When households devote a large share of income to rent, an unexpected shortfall in income may leave them unable to pay rent and could lead to eviction. Moreover, households that have little income left after paying rent may not be able to afford other necessities, such as food, clothes, health care, and transportation. The large share of income required for housing also limits the ability to save and accumulate wealth.
To assess the rent burden on families, we analyze housing expenditures of renters using the American Community Survey (ACS) Public Use Microdata Sample (PUMS). Consistent with the U.S. Department of Housing and Urban Development (HUD), we define “rent burdened” as spending more than 30 percent of income on housing and “severely rent burdened” as more than 50 percent. We also compare the amount of income left after housing costs (or “residual income”) to the Supplemental Poverty Measure.3 Recognizing that most renters in the upper 80 percent of the income distribution are not rent burdened, we primarily focus on those renters in the bottom quintile. The typical low-income renter faces severe rent burden, and this burden is largely similar across geographies. Additionally, low-income renters with children under age 18 face particularly high rent burdens and low “residual incomes,” while older renters have somewhat lower rent burdens.
Rent burdens and residual incomes, by income quintile
The median renter in the lowest income quintile pays 56 percent of monthly income on rent, exceeding HUD’s standard for “severe rent burden” (Figure 1). Severe rent burdens are generally not present among renters with income above the lowest quintile. In the second quintile of income, the median rent-to-income ratio is 28 percent, slightly below HUD’s “rent burden” standard. The median renter household in each of the higher income quintiles spends less than 20 percent of their income on rent. Even though the typical higher-income renter is not rent burdened, some higher-income renters do pay large shares of income on housing.
Percent of income on spent on rent
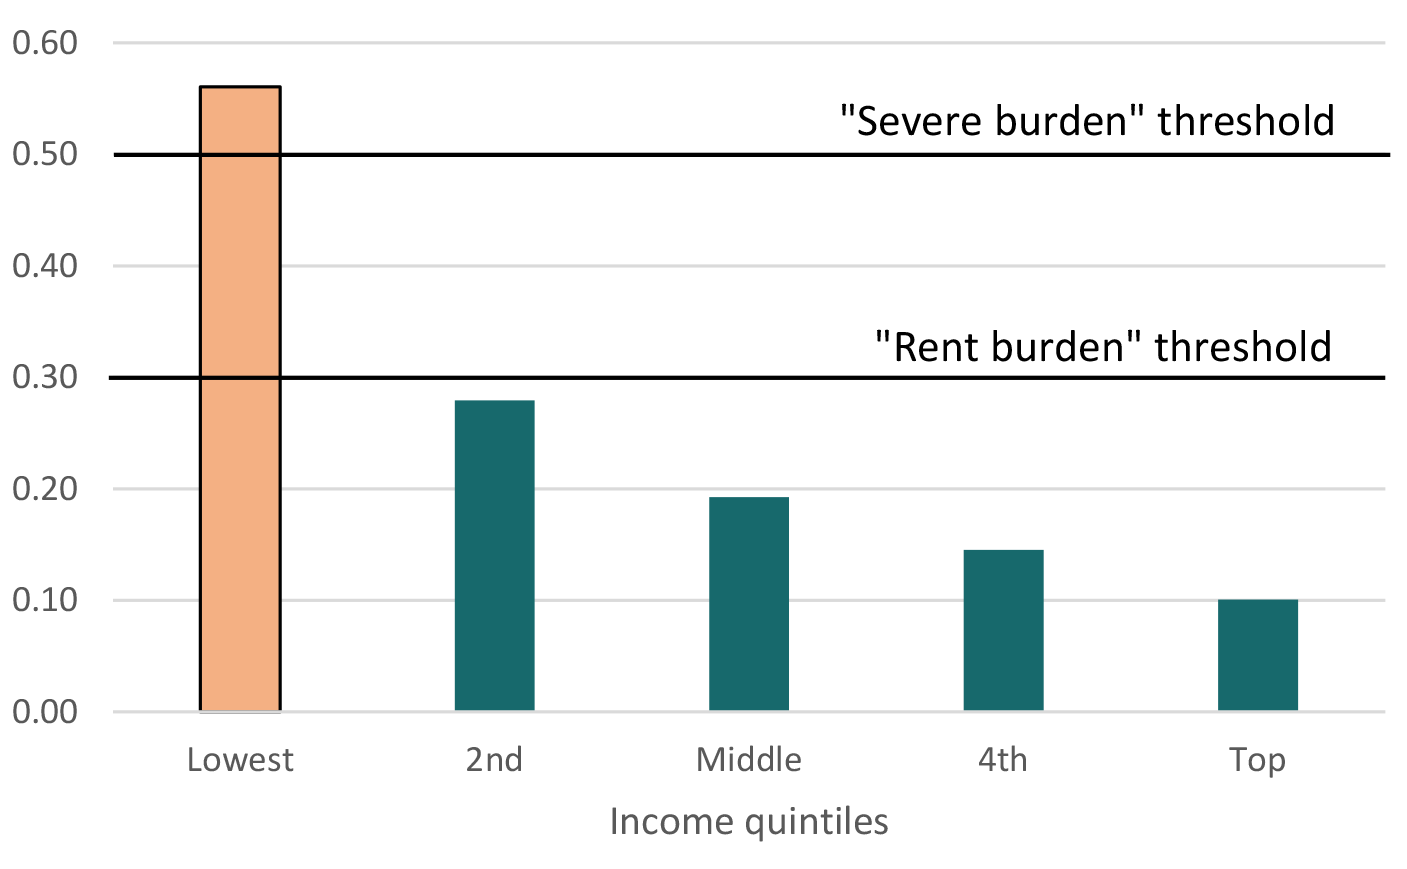
Notes: Calculations using 2015 ACS PUMS data. Median values by income quintile for renter households in 2015. Income quintiles are defined by local income. All rent and income results exclude homeowners and those who do not pay cash rent. Rent is based on the contract rent for the housing unit. Income is the pre-tax, post-cash-transfer income of the household.
Source: 2015 American Community Survey from the U.S. Census Bureau.
To determine the sufficiency of income left after paying rent, we use the non-housing portion of the Supplemental Poverty Measure (SPM) thresholds.4 In 2015, the SPM estimated that a family of four on the border of poverty would have needed just under $1400 per month to cover non-housing expenses. The median monthly income after rent for the lowest-income renters is only one third of this amount. The median renter in the second income quintile has income left after rent that is 140 percent of the non-housing poverty threshold.
Lower rent-to-income ratios and higher “residual incomes” among higher income households imply that rental payments do not rise proportionally with income. The lowest income renters pay about half the median rent of the highest income renters (but earn only 10 percent of their income).
Table 1: Low-income renters have little income remaining after rent
Make Full Screen
| Income quintiles | Income after rent ($) | Fraction who rent |
|---|---|---|
| Lowest | 476 | 58 |
| 2nd | 1,933 | 46 |
| Middle | 3,691 | 35 |
| 4th | 6,127 | 24 |
| Top | 11,191 | 13 |
| All renter households | 2,156 | 35 |
Notes: See Figure 1. Median values by income quintile, defined by local income.
Source: See Figure 1.
Among low-income renters, nearly three-quarters have a residual income that is under the supplemental poverty threshold and 48 percent have a residual income that is less than half of this threshold.5 Fewer than 10 percent of renters in the second quintile have a residual income that falls short of the Supplemental Poverty Measure’s threshold. Less than one percent of renters above the 2nd quintile have this income shortfall.
Although renters in the bottom quintile appear particularly rent burdened, tax credits, rental assistance, and other in-kind benefits mitigate some of the burden. This assistance is typically not captured in our data. For example, in 2015 a low-income couple with two children whose wage income is at the median of the bottom quintile would qualify for an earned income tax credit of nearly $5,000 annually and may also be eligible for Supplemental Nutrition Assistance Program (SNAP) benefits of up to $4,000 per year. These benefits are available to a lesser degree to households in the 2nd income quintile and are phased out for most households in the 3rd quintile or above.
Changes in rent burdens over time
The share of income spent on rent has increased substantially for low-income households since 2000. In 2015 the median renter in the bottom quintile of the income distribution spent 11 percentage points more of their income on rent than in 2000 (Figure 2). This increase in rent burdens over the past 15 years occurred through each business cycle period including both the period prior to the financial crisis (2000-2006), the economic downturn (2006-2009) and the subsequent recovery (2009-2015). Although rent-to-income ratios are greatest among low-income households, the share of income spent on rent also rose among higher income renters (not shown).
Percent of income on spent on rent
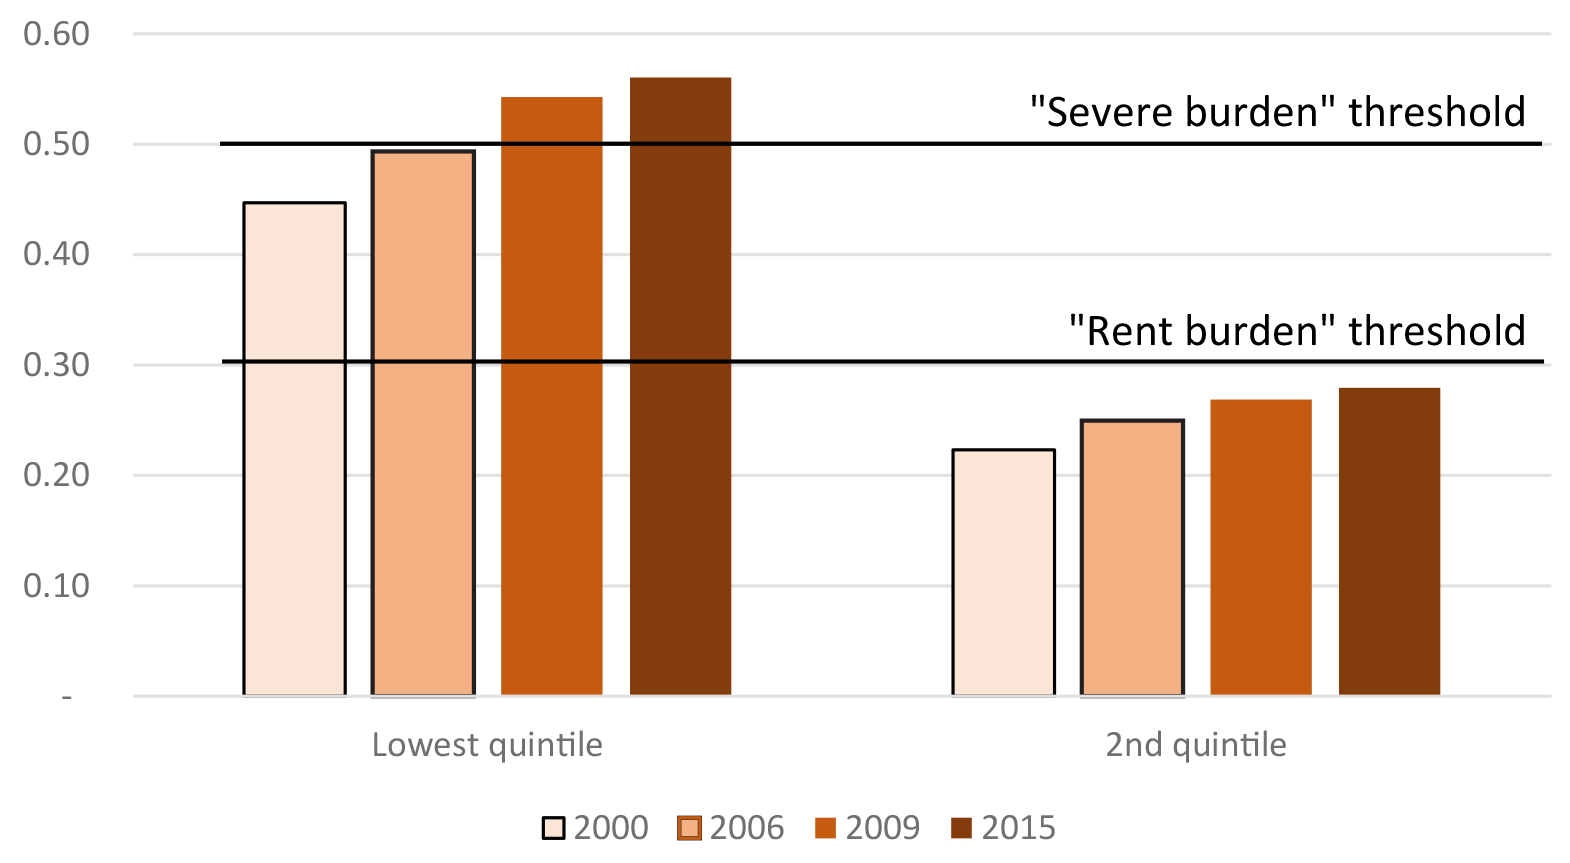
Notes: See Figure 1. Median values by income quintile, defined by local income.
Source: The 2000 Decennial Census and the 2006, 2009, and 2015 American Community Survey from the U.S. Census Bureau.
Figure 3 demonstrates the trend in residual income (after covering rental expenses) for renters in the bottom income quintile over this period. Consistent with the rising rent burden over time in Figure 2, inflation-adjusted residual incomes have also fallen among low-income renters. Over this period, rents rose for the low-income population while their median incomes fell by just over $100. Both trends contribute to greater levels of economic hardship, and jointly result in the decline in residual incomes for low-income renters. Of the overall decline in residual income since 2000, around two-thirds came from declines in income among renters and one third resulted from rising rents.
Figure 3: Incomes have dropped and rents have risen for low-income families, decreasing “residual incomes”
Monthly amount ($)
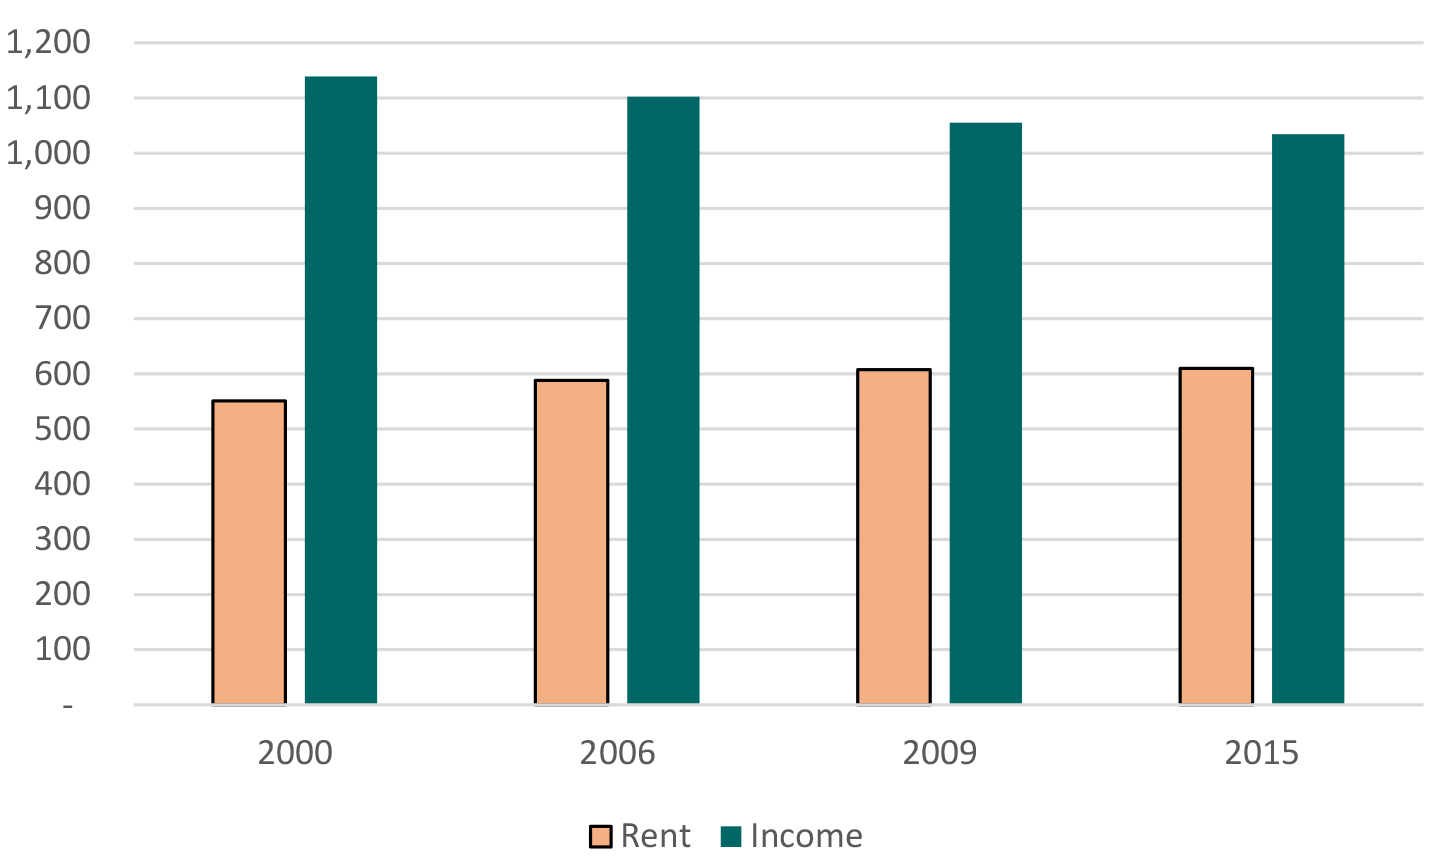
Notes: See Figure 1. Median values for the lowest income quintile, defined by local income. All values are inflation-adjusted to 2015 dollars using the CPI-U-RS. Difference between rent and income is “residual income”.
Source: See Figure 2.
Geographic variation in rent burdens and residual incomes
The challenge of rent burdens extends to micropolitan and rural areas as well as larger cities. Rent-to-income ratios for low-income renters are highest within metropolitan areas and lowest in rural areas, but all are above HUD’s rent burden threshold (Table 2).6 Similarly, when considering income left after housing expenses, the lowest quintile of renters in all geographic areas similarly fall well below the residual income expected to remain out of poverty.
High rent burdens also represent a challenge for the lowest-income households irrespective of where they live in the country. Rent-to-income ratios are highest in the Northeast and West, although the typical low-income renter in all four regions are near, or above, the HUD standard for being severely rent burdened.7
Table 2: Low-income renters face high cost burdens in all geographies
Make Full Screen
| Rent/income | Income after rent ($) | Fraction who rent | |
|---|---|---|---|
| Level of urbanization | |||
| Metropolitan areas | 0.58 | 468 | 60 |
| Micropolitan areas | 0.45 | 518 | 47 |
| Rural areas | 0.41 | 531 | 42 |
| Region of country | |||
| Northeast | 0.60 | 443 | 65 |
| South | 0.54 | 484 | 54 |
| Midwest | 0.49 | 534 | 58 |
| West | 0.64 | 428 | 62 |
Notes: See Figure 1. Median values in 2015 for the lowest income quintile, defined by local income.
Source: See Figure 1.
Rent burdens by household structure
Two groups that often warrant additional attention in public policy discussions are families with children and the elderly. Low-income renters with children pay a median of three-fifths of their monthly income on rent, leaving under $450 in residual income (Table 3). Low-income older renters pay a lower share of their income on rent, and have higher residual incomes. Moreover, over 70 percent of low income households with children rent their homes. However, counterbalancing the somewhat higher rent-to-income ratios for low-income families with children, tax credits and non-cash benefits that are excluded from traditional cash pre-tax income measures are typically larger for families with children than for either elderly or non-elderly adults without children.
Table 3: Low-income families with children and renters of all races and ethnicities face heavy rent burdens
Make Full Screen
| Rent/income | Income after rent ($) | Fraction who rent | |
|---|---|---|---|
| Family Structure | |||
| With kids < 18 yrs | 0.60 | 443 | 73 |
| Head 65+ | 0.44 | 593 | 38 |
| Race and Ethnicity | |||
| White | 0.55 | 496 | 48 |
| Black | 0.54 | 454 | 74 |
| Asian | 0.78 | 250 | 65 |
| Hispanic | 0.57 | 496 | 72 |
Notes: See Figure 1. Median values in 2015 for the lowest income quintile, defined by local income.
Source: See Figure 1.
Low-income renters of all races and ethnicities face high rent-to-income ratios and low residual incomes. Rent burdens are somewhat higher for low-income Hispanic renters than for white renters, although the rent burden for whites is slightly above that seen among blacks.8 However, higher proportions of low-income Blacks, Asians and Hispanics are renters, compared to low-income white families.
Conclusion
In this note, we have shown that the lowest-income families face severe rent burdens. Rent burdens have increased over the past 15 years, due to both increasing rents and decreasing incomes. Prior research has shown that households who spent large shares of their income on rent or other housing expenditures have lower economic well-being.9 These rent burdens are a potential source of stress and financial instability to households, particularly for low-income families with children.
1. The analysis and conclusions set forth are those of the authors, and do not indicate concurrence by other members of the research staff or the Board of Governors or other staff in the Federal Reserve System. Christina Park contributed excellent research assistance. Return to text
2. Recent studies include: Desmond, Matthew (2016). Evicted: Poverty and Profit in the American City. New York, NY: Crown Publishers; Edin, Kathryn J. and H. Luke Shaffer (2016). $2.00 a Day: Living on Almost Nothing in America. New York, NY: Houghton Mifflin Harcourt Publishing; Gabriel, Stuart and Gary Painter (2017). “Why Does Housing Affordability Matter?” Working Paper. Return to text
3. https://www.huduser.gov/portal/pdredge/pdr_edge_featd_article_092214.html Return to text
4. The non-housing portion of the Supplemental Poverty Measure is computed here using data from Renwick, Trudi and Liana Fox (2016). “The Supplemental Poverty Measure: 2015.” Census Bureau Report P60-258 (https://www.census.gov/library/publications/2016/demo/p60-258.html) and Garner, Thesia I (2010) “Supplemental Poverty Measure Thresholds: Laying the Foundation.” (https://stats.bls.gov/pir/spm/spm_pap_thres_foundations10.pdf). For the purposes of this Note, utilities are treated as a non-housing expense in the Supplemental Poverty Measure threshold since they are typically excluded from contract rent. Return to text
5. These percentages account for different household sizes in the Supplemental Poverty Measure threshold. For simplicity in this analysis, we focus on the household (rather than the family) and assume that the first two people in each household are adults and all other household members are children. Based on the official SPM values, single-parent households will have somewhat lower poverty thresholds (meaning these individuals are less likely to appear rent burdened based on their residual income) and households with three or more adults will have somewhat higher poverty thresholds than is observed in this analysis. Return to text
6. Rural areas are defined here as anywhere not in a metropolitan and micropolitan statistical areas. Return to text
7. Analyzing patterns by metro status within region gives similar results to those presented in Table 2. Return to text
8. The choice of whether to focus on contract rent or gross rent impacts the relative relationship between the burdens of white and black renters. For gross rent – which includes reported utility expenses that are not part of the rental contract – low income black renters appear slightly more rent burdened than white respondents. The different results using the two separate rent measures may reflect differences in the types of rental units for black and white renters, differences in which utilities are included as part of the rental contract for these renters, or differences in the average utility expenses among these renters when they are paying out of pocket for utilities. Return to text
9. Bartfeld, Judi and Rachel Dunifon (2005). “State-level Predictors of Food Insecurity among Households with Children” Journal of Policy Analysis and Management 25(4): 921-942 and Newman, Sandra J. and C. Scott Holupka (2015). “Housing Affordability and Child Well-Being” Housing Policy Debate 25(1): 116-151 Return to text
Please cite this note as:
Larrimore, Jeff, and Jenny Schuetz (2017). “Assessing the Severity of Rent Burden on Low-Income Families,” FEDS Notes. Washington: Board of Governors of the Federal Reserve System, December 22, 2017, https://doi.org/10.17016/2380-7172.2111.
Disclaimer: FEDS Notes are articles in which Board economists offer their own views and present analysis on a range of topics in economics and finance. These articles are shorter and less technically oriented than FEDS Working Papers.