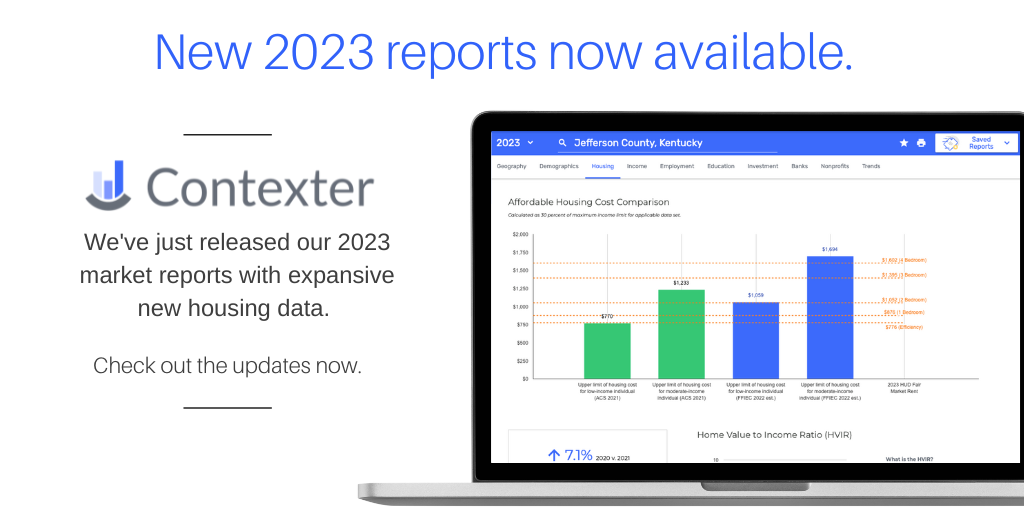
Our updated and enhanced 2023 Contexter Market Reports are now available! Not only have we updated each data point for 2023, but we also significantly expanded our housing section to provide even more detailed insights on housing characteristics and affordability in each market.
1. Updated data for 2023
Our Contexter Market Reports contain over 200 pieces of data to assist you with performance context research in any county in the nation. With this release, we’ve updated each existing data point within the Contexter Market Reports to the most recent release from the government and industry data sources you rely on. Review the updated source list for 2023.
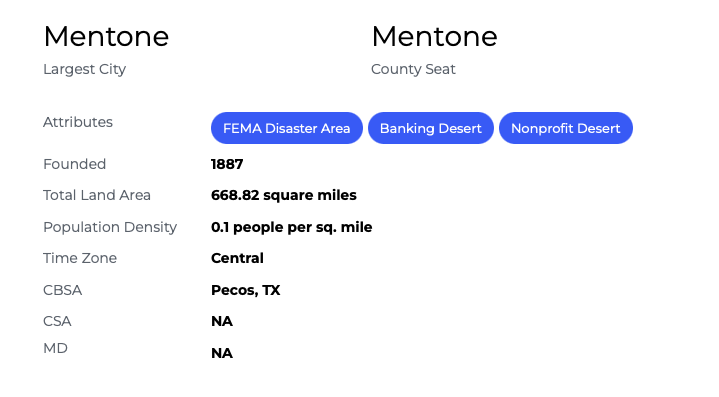
2. New geography attributes
We’ve added brand new geography attributes in the first section of each Contexter Market Report to help you quickly identify if a county meets certain qualifications. Our new geography attributes include FEMA Disaster Area, FFIEC Distressed, FFIEC Underserved, Majority LMI, Banking Desert, or Nonprofit Desert. We’ve also added the Metropolitan Division data to the geography section.
3. Expanded details on housing characteristics
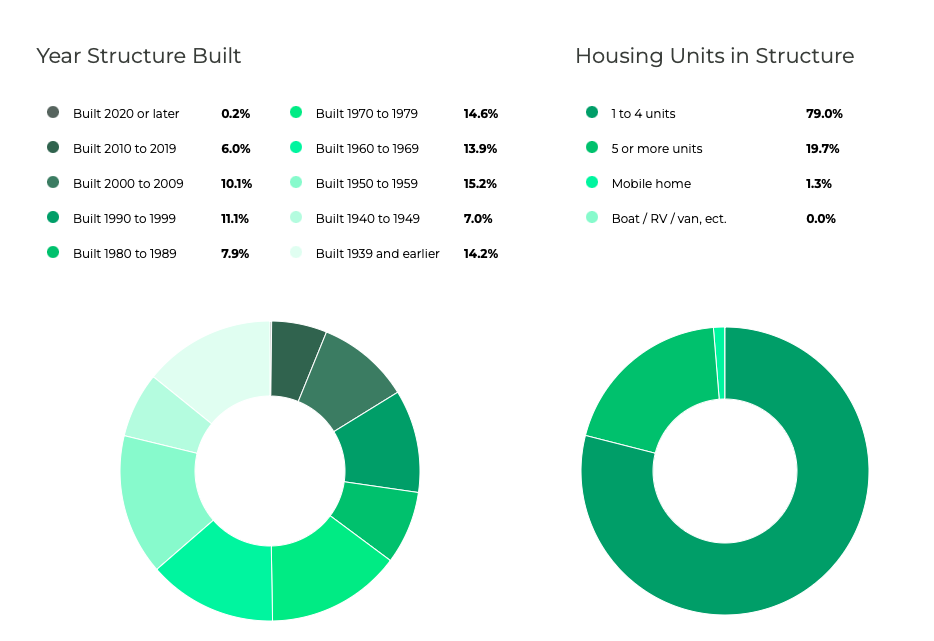
With this year’s update, we’ve incorporated several new sections of housing characteristics data to help you better evaluate the housing market in each county. New charts include:
- Year Structure Build: Details on the year each housing unit was built divided into ten levels to help you determine overall age of housing stock and new construction activity.
- Housing Units in Structure: See what percentage of the housing units in each market are 1- to 4-family residences, multifamily, mobile homes, or other types of housing.
- Year Homeowner Moved In: Evaluate overall homeowner moves within the market, subdivided into six levels.
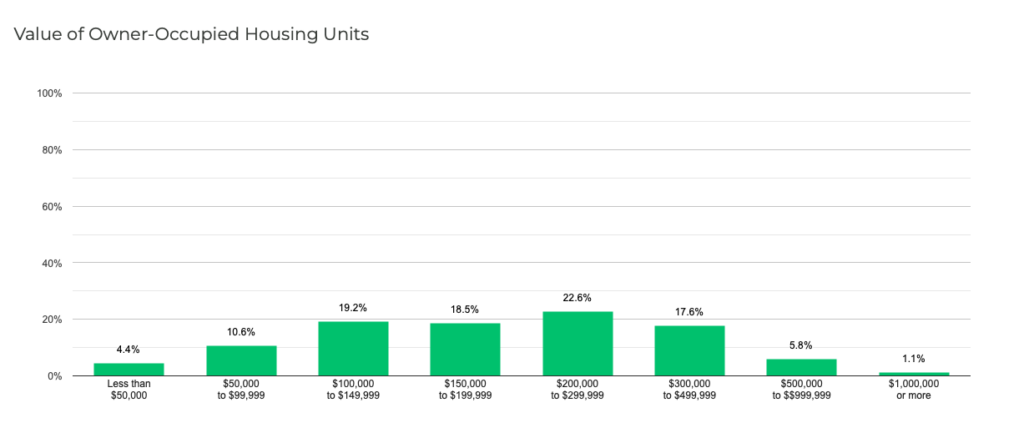
4. Visualize housing values
Our new chart of the value of owner-occupied housing units helps you to visualize and illustrate the dispersion of housing values within each market spread across eight levels.
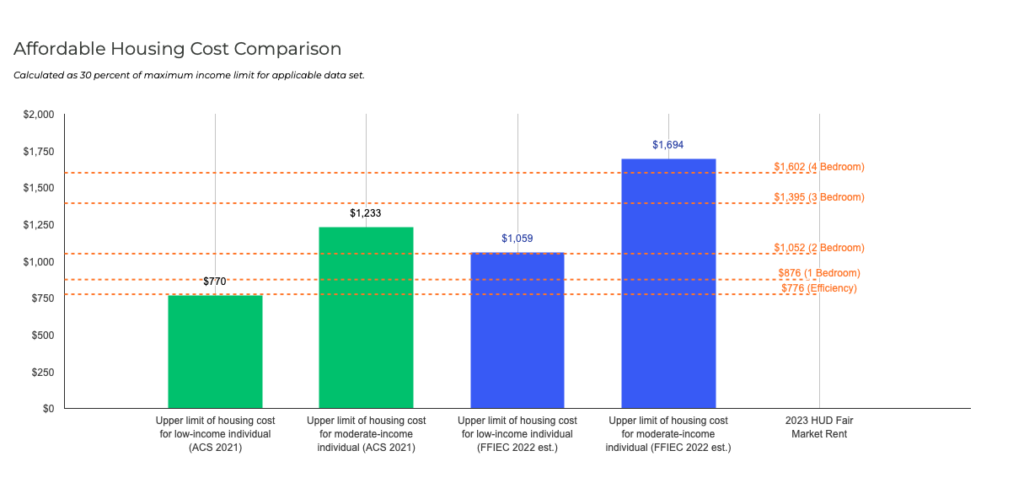
5. Instant insights into affordable housing costs
Determining affordable housing costs for low- and moderate-income individuals has never been easier. Our new Affordable Housing Cost Comparision chart calculates the upper maximum affordable housing costs for a low-income or moderate-income individual based on the 2021 American Community Survey Median Income and the FFIEC 2022 estimated Median Family Income in each county. We’ve also incorporated the 2023 HUD Fair Market Rents to allow for quick analysis of affordable housing limits.
6. Compare key ratios impacting housing affordability
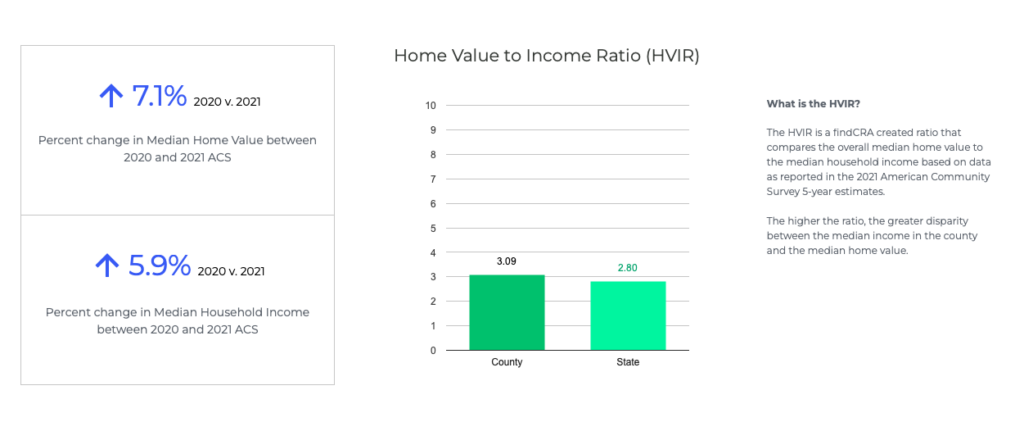
This year, we included a snapshot of the overall percentage changes in Median Home Value and Median Income as reported in the American Community Survey data to help you determine changes year-over-year.
We’ve also created our new HVIR ratio, which compares the Median Home Value to Median Income in the county and state. The higher the HVIR, the greater disparity between the median income and the median home value.
7. New unemployment data
In our Employment section, we’ve added the total number of unemployed individuals in each county.
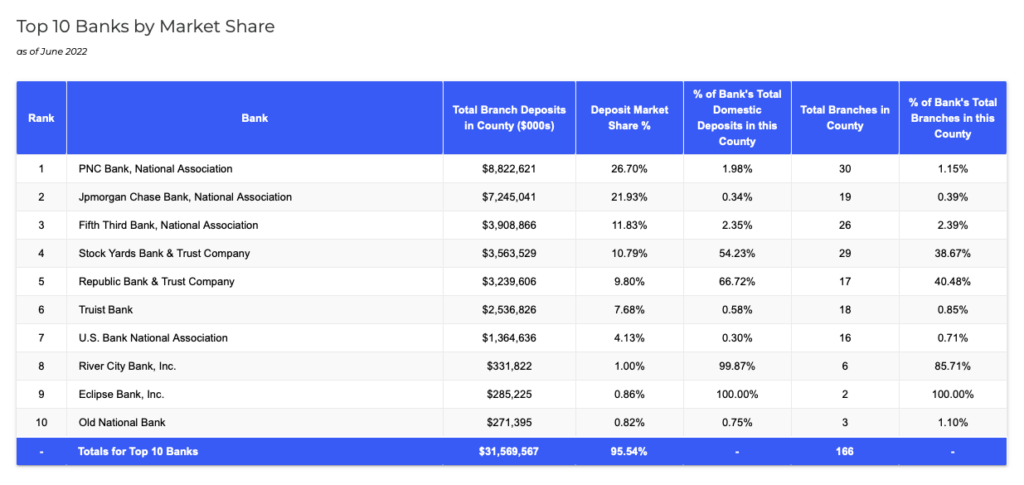
8. Updated Top 10 Banks Chart
To clearly illustrate the percentage of the market held by the top 10 banks in each county, we’ve added a total row at the bottom of the banking chart. This row provides a quick sum of the overall percentage of deposit market share held by the top 10 banks collectively in each market, as well as the total number of branches operated by the top 10 banks.
Not yet a Contexter user?
Schedule a demo of our Contexter platform with the findCRA team today.