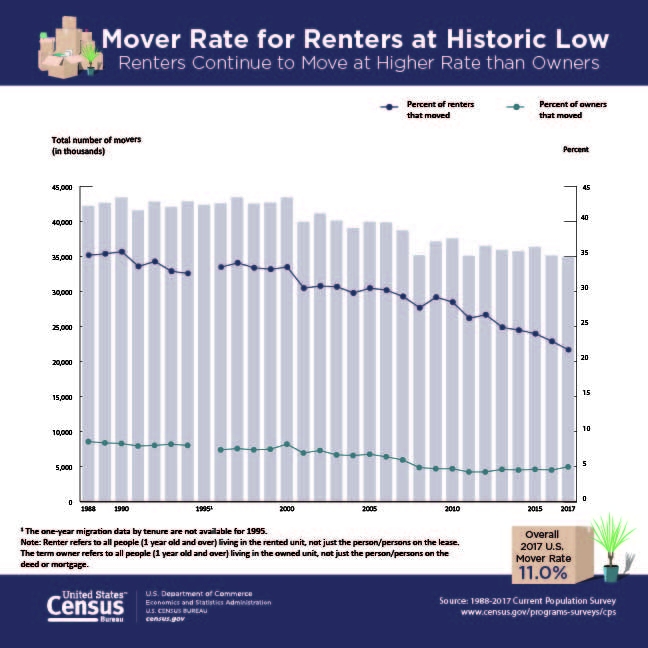
The rate at which renters moved in 2017 was at a historic low of 21.7 percent, compared to 35.2 percent in 1988, according to new U.S. Census Bureau data released today from the Current Population Survey. However, renters still moved at a higher rate than owners (21.7 percent compared with 5.5 percent, respectively).
“Although renters continued to move at higher rates compared to owners, the decrease in the overall mover rate was partially driven by declining mover rates for renters,” said Charlynn Burd, a geographer with the Social, Economic and Housing Statistics Division. “Housing reasons continued to be the most often cited reason for moving.”
In 2017, 43 percent of movers reported moving for a housing-related reason. In comparison, 27.9 percent said they moved for a family-related reason, 18.5 percent said they moved for an employment-related reason, and 10.6 percent said they moved for some other reason.
The mover rate for U.S. residents 1-year-old and over was 11.0 percent (34.9 million), which remained statistically unchanged from last year’s all-time low of 11.2 percent (35.1 million), according to the new data.
The lowest mover rate by region in 2017 was the Northeast (8.3 percent), followed by the Midwest (11.4 percent), West (11.5 percent) and then the South (11.8 percent). The Midwest, West and South were not statistically different from one another.
The highest mover rates by race were the black or African-American alone population (13.1 percent) and the Asian alone population (12.1 percent). The white alone population moved at a rate of 10.3 percent. The Hispanic or Latino population (11.7 percent) had a higher mover rate than the non-Hispanic white population (10.0 percent).
The selected statistics released today come from Geographical Mobility: 2016 to 2017, a collection of national-and regional-level tables from the Current Population Survey Annual Social and Economic Supplement. The tables describe the movement of people in the United States, including type of move, reason for moving and characteristics of those who moved during the past year.
Additionally, selected statistics were released today from Geographical Mobility: 2010 to 2015, which are based on five-year migration responses.
In 2015, 99.8 million people 5 years and older had moved within the previous five years. However, this is not statistically different from the 100.2 million who moved within the previous five years in 2010.
The five-year moving rate estimate for U.S. residents is now the lowest in Current Population Survey history, declining to 33.7 percent in 2015 from 35.4 percent in 2010.
Among young adults, five-year moving rates were higher than the national average of 33.7 percent. For 18- to 24-year-olds, 45.2 percent moved in 2015, down from 48 percent in 2010. Among 25- to 29-year-olds, 61.2 percent moved in 2015, down from 65.5 percent in 2010. For 30- to 34-year-olds, 52.5 percent moved in 2015, while 57.0 percent moved in 2010.
Also released today were updated historical tables and graphs on migration with selected statistics extending back to 1948.
Products available today with this release are:
- Geographical Mobility: 2016 to 2017 Current Population Survey Annual Social and Economic Supplement
- Geographical Mobility: 2010 to 2015 Current Population Survey Annual Social and Economic Supplement
- State-to-State Flows: 2016 American Community Survey 1-Year Estimates
- State of Residence by Place of Birth Flows: 2016 American Community Survey 1-Year Estimates
The Census Bureau collects, produces and publishes a range of statistics on geographic mobility and migration using multiple data sources. For more information about these data sources and the types of data they produce on geographic mobility, see the Migration/Geographic Mobility page.